1.Bitcoin Market
During the period from May 10 to May 16, 2025, the specific price movements of Bitcoin were as follows:
May 10:Bitcoin showed a slow upward trend throughout the day. It briefly broke above $103,347 before experiencing a technical pullback to around $103,000. Bulls then regained momentum, pushing the price up to a daily high of $103,963. Due to some profit-taking, the price slightly retreated by the end of the day, closing at $103,189.
May 11:Bitcoin continued its upward trend, reaching an intraday high of $104,916 before entering a consolidation phase, fluctuating within a narrow range between $103,460 and $105,000. The tug-of-war between bulls and bears intensified, with the overall trend still slowly moving upward in an attempt to break the resistance above.
May 12:The price action followed the previous day’s consolidation pattern. It briefly broke upward to reach a high of $105,493. However, significant selling pressure quickly emerged, driving the price down to $103,860, then $102,536, and eventually to a low of $101,311, breaking below the critical $102,000 support level, with bearish sentiment temporarily dominating.
May 13:After a slight rebound in the morning to $103,119, Bitcoin fell to a low of $101,650. The market then resumed a corrective rebound, reaching $102,848 and $103,879 successively. Despite minor technical pullbacks, the overall trend indicated that bulls were still providing some support.
May 14:Bitcoin extended the previous day’s rebound momentum, climbing to an intraday high of $104,965, marking a short-term peak. However, it encountered strong resistance around this level, leading to a price decline to around $103,500. The market then dropped further to $103,010 but found short-term support there and quickly rebounded to $104,269. Nevertheless, the price failed to hold above this level, turning into a downward consolidation. By the end of the day, it hit a low of $102,923, indicating intensified contention between bulls and bears.
May 15:Bitcoin opened around $103,400. After a slight early pullback to $102,888, it rebounded briefly to an intraday high of $103,840. However, lacking upward momentum to break key resistance levels, the price quickly turned downward again. It broke below the critical $102,000 support level, dropping to a low of $101,682, showing that bearish sentiment was temporarily dominant. Though there was a brief rebound to $102,801 in the evening, the price failed to stabilize and fell again to $101,698. Toward the end of the session, bullish forces recovered somewhat, triggering a strong upward rebound.
May 16:Continuing the bullish momentum from the previous night, Bitcoin surged to $104,083. It then retraced to a low of $102,701. After that, the price steadily climbed. As of the time of writing, Bitcoin was trading at $103,893. If bullish sentiment continues, the market may further challenge the key resistance zone above.
Summary:
This week, Bitcoin exhibited a price pattern characterized by “surge—pullback—consolidation recovery.” The price rose steadily early in the week but failed to break higher, leading to a sharp drop that briefly breached the $101,000 support level, with bearish sentiment taking the lead. Despite entering a technical recovery phase and rebounding multiple times to as high as $104,965, the lack of consistent buying momentum led to weak rebounds and renewed selling pressure. The trend then reverted to a downward consolidation, and on May 15, Bitcoin revisited the week’s second-lowest point at $101,698. Entering May 16, bullish momentum showed signs of recovery. The short-term trend remains range-bound, and attention should remain on whether the price can break above the key resistance zone.
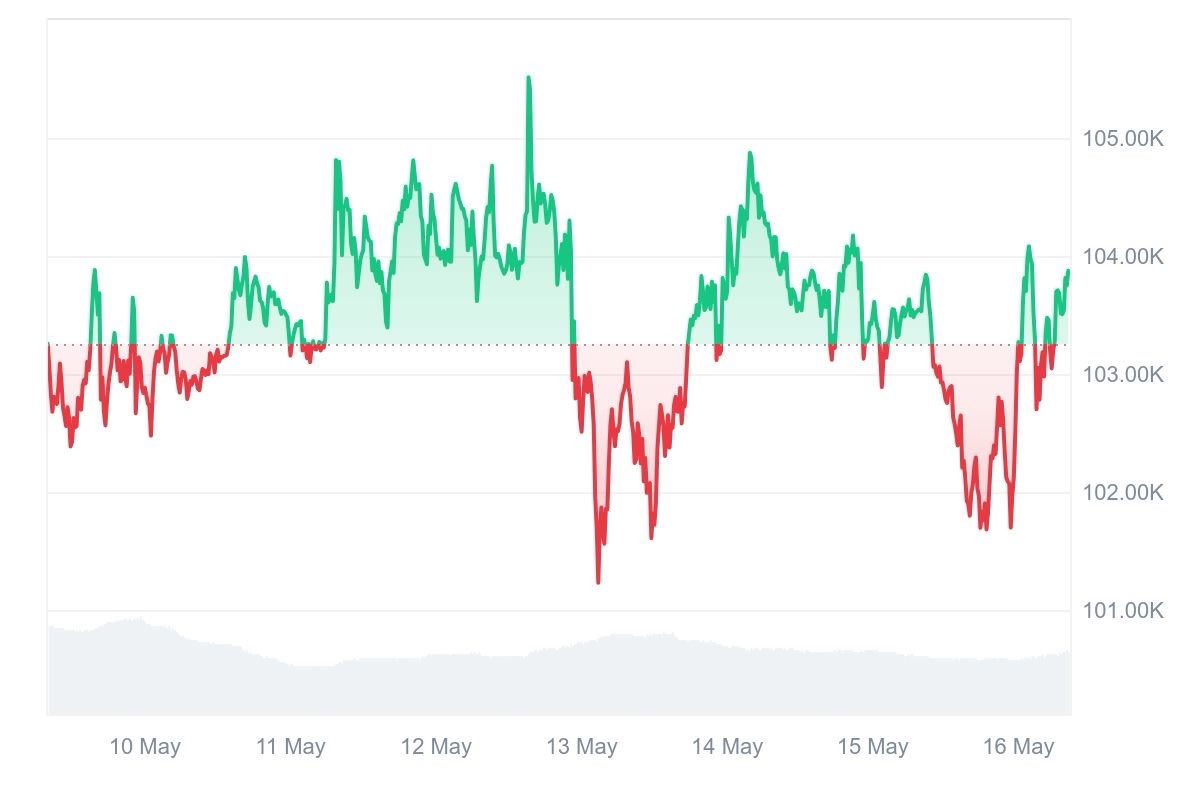
Bitcoin Price Trend (2025/05/10–2025/05/16)
2. Market Trends and Macro Background
Capital Flows
1.Market Overview: Bitcoin Dominance Declines
As of May 14, 2025, data from TradingView shows that Bitcoin dominance dropped to 62.01%, a decrease of approximately 3% from 63.93% earlier this week.
The decline in Bitcoin dominance may indicate a shift of capital from Bitcoin to other crypto assets, or a weakening market demand for Bitcoin.
2.Exchange Capital Flows and Investor Structure Shifts: Retail and Whale Funds Entering Simultaneously
Net Outflows from Centralized Exchanges (CEXs)
According to Coinglass data, on May 10, 2025, centralized exchanges saw a total net outflow of 6,198.60 BTC over the past 24 hours. The top three exchanges by outflow volume were:Bithumb: 2,792.60 BTC outflow;Bitfinex: 2,221.76 BTC outflow;Kraken: 1,331.13 BTC outflow
Additionally, Binance recorded a net inflow of 421.73 BTC during the same period, ranking first in inflows.
Whale Transaction Activity
May 11: According to Lookonchain monitoring, a whale address deposited 900 BTC (worth approximately $93.75 million) to Binance 6 hours ago.
May 12: The same whale address purchased another 821 BTC, valued at about $85.42 million. Data shows the address acquired a total of 1,721 BTC over two days, worth roughly $179 million.
Institutional Capital Outflows
May 13: According to André Dragosch, Head of Research Europe at Bitwise, 9,739 BTC were just transferred out of Coinbase, setting the highest net outflow record for the year. This suggests that institutional demand for Bitcoin is rapidly increasing.
Retail Investment Enthusiasm Rebounds
During the same period (April 28 to May 13), CryptoQuant analyst OroCrypto reported that retail traders are clearly returning to the Bitcoin market. Retail investor buying volume has grown by +3.40% since turning positive on April 28, indicating a notable rise in interest among small-scale investors and a resonance trend forming alongside whale capital inflows.
3.Bitcoin ETF Capital Flows: Net Outflow Trend
According to CoinGlass data, as of May 16, 2025, Bitcoin spot ETFs saw a total net outflow of $426 million over the past 7 days.
Daily ETF inflow/outflow breakdown this week:
May 12: +$5.2 million
May 13: -$91.4 million
May 14: +$319.5 million
May 15: -$294.8 million
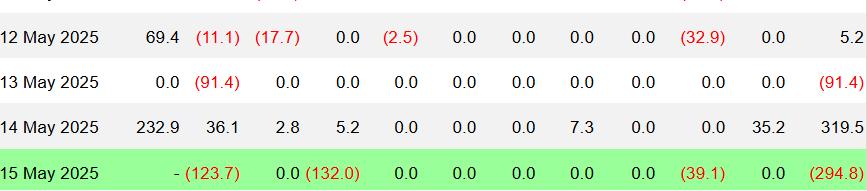
ETF inflow/outflow chart image
Although there was a capital rebound on May 14, the overall trend still shows weakening investor interest in Bitcoin ETFs, likely influenced by market volatility and macroeconomic factors.
Technical Indicator Analysis
1.Relative Strength Index (RSI 14)
According to Investing.com data, as of May 16, 2025, Bitcoin’s 14-day Relative Strength Index (RSI) stands at 58.99, positioned in the neutral-to-bullish zone, indicating that there is still room for upward movement and the price has not yet entered the technically overbought range. At the same time, the platform’s overall technical indicator signal is “Strong Buy,” reflecting a predominantly bullish market sentiment.
Previously, on May 12, BTC Markets analyst Rachael Lucas noted that although there are no typical signs of overbought conditions at present, the market may experience short-term consolidation or a pullback after a sustained rise. “If Bitcoin can consolidate sufficiently above $100,000 and confirm support, it will help solidify the foundation for further upward movement,” she said.
2.Moving Averages (MA) and MACD Joint Analysis
5-day moving average (MA5): $103,680.44
20-day moving average (MA20): $97,406.63
50-day moving average (MA50): $89,153.59
200-day moving average (MA200): $83,762.11
Current market price: $103,893
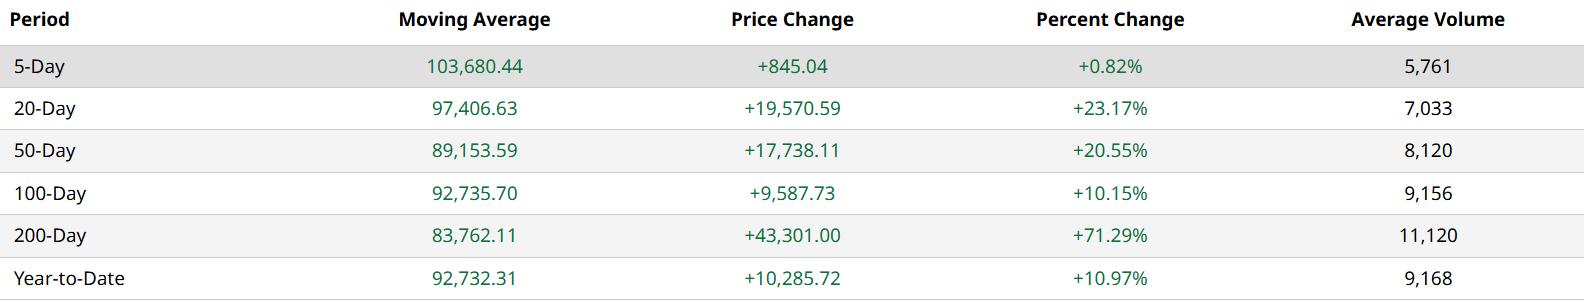
MA5, MA20, MA50, MA200 data chart image
The current price has broken above all major moving averages and is slightly higher than the short-term MA5, indicating that the short-term trend remains strong. At the same time, both MA20 and MA50 show a clear upward trajectory, further confirming a bullish medium-term trend. The MA200 remains significantly below the current price, suggesting that the long-term bullish structure is still solid. The overall alignment of the moving averages in a bullish formation (MA5 > MA20 > MA50 > MA200) is a classic signal of a strong upward trend.
This technical structure typically suggests a high trend continuation probability. Unless there is a significant bearish catalyst in the short term, the market may continue its upward trend.
More notably, the weekly MACD has also issued a key bullish signal. According to Coindesk analyst Omkar Godbole, as of May 14, Bitcoin’s weekly MACD histogram has successfully broken above the zero axis, marking a resurgence in medium- to long-term bullish momentum. This technical breakout coincides with Bitcoin rebounding from the 50-week Simple Moving Average (SMA), mirroring similar patterns seen in early 2023 and mid-2024—periods that both preceded significant price rallies.
Historical data shows that the MACD has entered the positive territory only five times in the past five years, with only one false signal (in March 2022), suggesting this indicator has high reliability in identifying trend reversals. If this signal follows historical patterns, the market could be poised for a new medium- to long-term bull run.
In summary, the alignment of short-, medium-, and long-term moving averages with the bullish weekly MACD signal reinforces the current bullish trend. Provided there are no major bearish events, Bitcoin is likely to maintain its upward trajectory and continue challenging historical highs.
3.Key Support and Resistance Levels
Support Zone: Bitcoin’s primary support range currently lies between $101,000 and $101,600. As a critical short-term support area, if the price falls back to this zone, it is expected to attract some bullish buying interest, potentially triggering a technical rebound.
Resistance Levels: Initial resistance is concentrated near $104,000 to $105,000. A successful breakout and consolidation above $105,000 could open the door to further upside potential.
Based on the above analysis, Bitcoin is currently at a key technical juncture. If the price breaks through $105,000 with increased trading volume, it may challenge the $107,000 high. Conversely, a break below the psychological level of $101,000 could lead to further correction. Investors should closely monitor price action at these key support and resistance levels, as well as changes in volume and technical indicators, to formulate appropriate trading strategies.
Market Sentiment Analysis
1.Optimistic with Greed Bias, Sentiment Maintains High Levels
Affected by Bitcoin’s price consolidating at a high level, this week’s overall market sentiment has been optimistic with a bias toward greed. The Fear & Greed Index remains in the “Greed” zone, reflecting investors’ continued positive attitude toward the market and a preference for risk. However, the sentiment indicator has not further risen, indicating a tug-of-war between cautious sentiment and optimistic expectations in the absence of new upward momentum. This pattern of “high-level greed but not blindly optimistic” suggests the market is waiting for clearer signals to determine the direction of the next phase.
2.Key Sentiment Indicator (Fear & Greed Index)
According to CoinMarketCap data, as of May 16, the Fear & Greed Index stood at 69, within the “Greed” zone, showing relatively positive investor sentiment. The sentiment index during the week was as follows: May 10: 71 (Greed);May 11: 75 (Greed);May 12: 73 (Greed);May 13: 71 (Greed);May 14: 74 (Greed);May 15: 71 (Greed).
The index fluctuated between 69 and 75 throughout the week, maintaining an overall “Greed” range and indicating relatively stable market sentiment, although potential volatility risks remain to be monitored.
The Fear & Greed Index is an important tool for measuring market sentiment, ranging from 0 (extreme fear) to 100 (extreme greed). The current index at 70 falls into the “Greed” category, suggesting relatively positive investor sentiment and some expectation for market gains. However, excessive greed may signal market overheating and the risk of a potential correction.
Moreover, the stability of the index also reflects market acceptance of the current price level, but in the absence of new driving factors, the market may enter a consolidation phase.
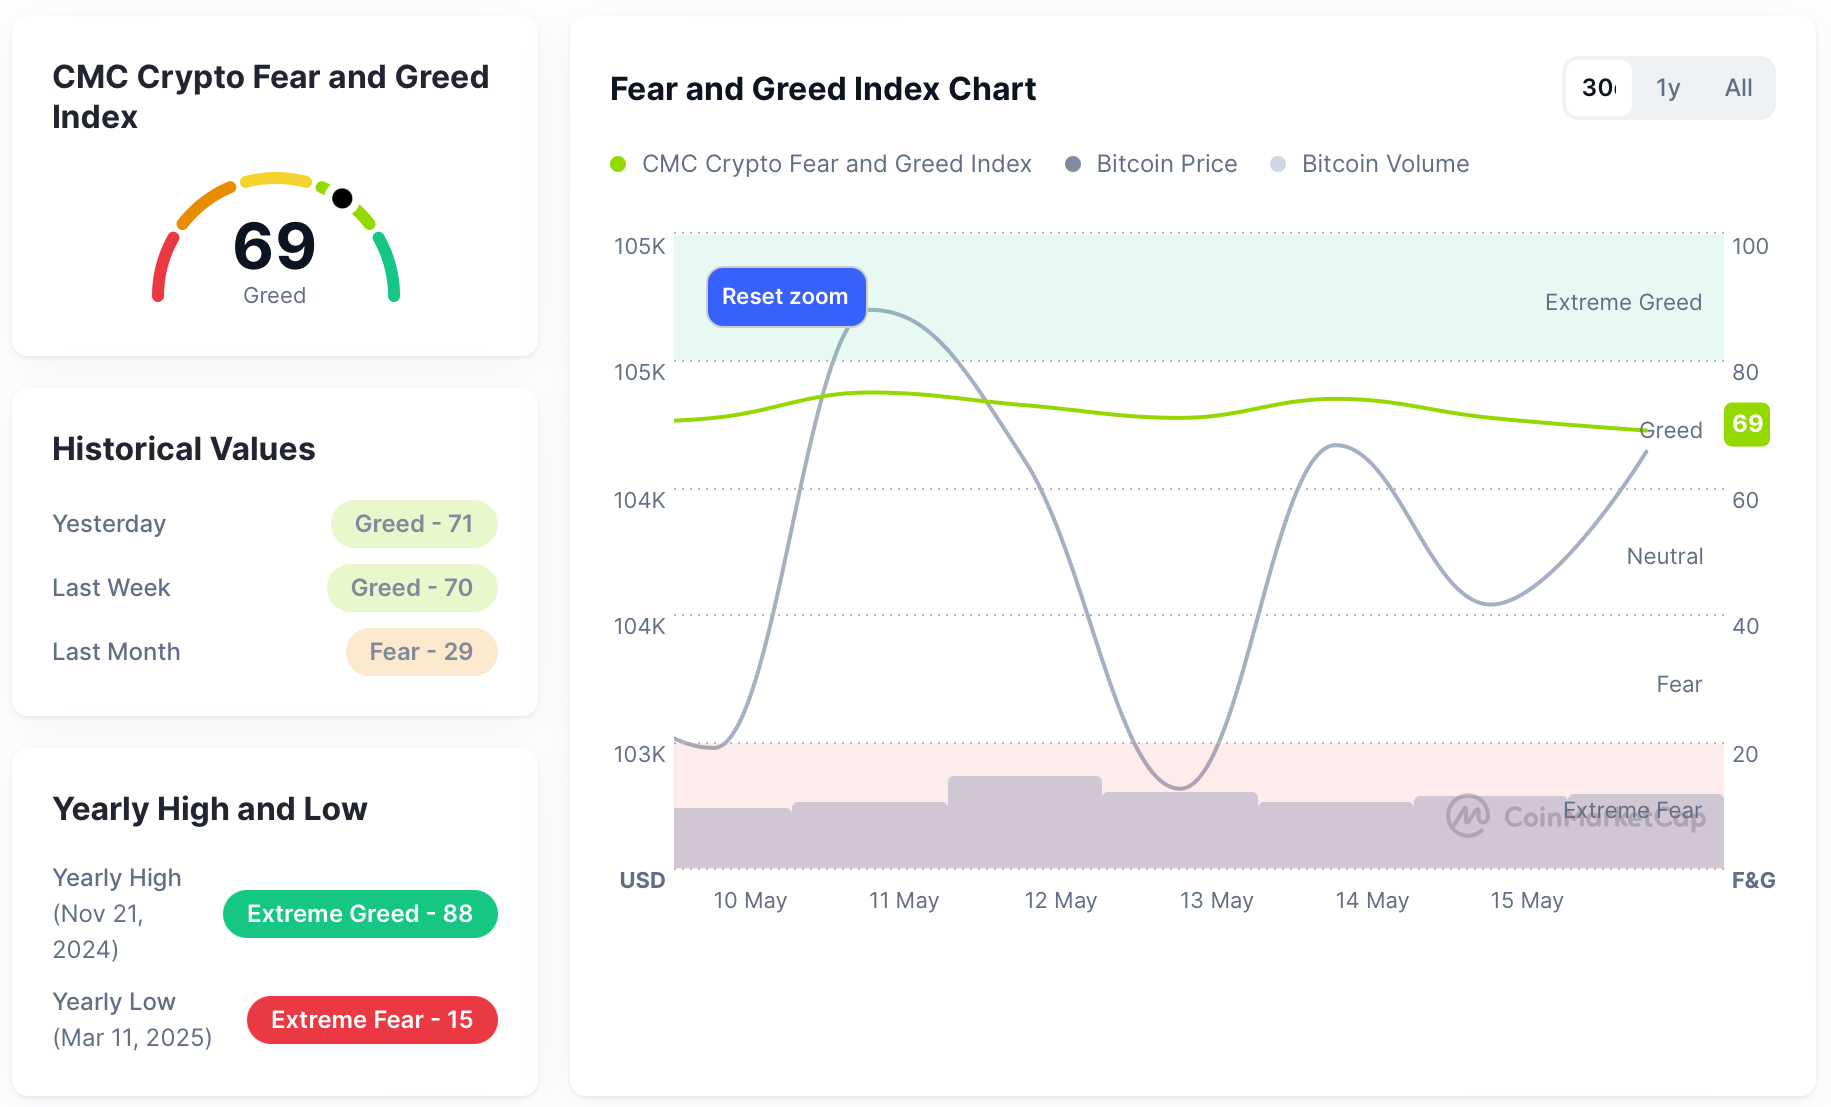
Fear & Greed Index data chart image
Macroeconomic Background
Federal Reserve Policy and Inflation Outlook
Although recent U.S. inflation data came in below expectations, indicating some easing of price pressures, Federal Reserve Vice Chairman Philip Jefferson expressed caution about future inflation in his speech on May 14. He pointed out that the new round of tariffs recently announced by the Trump administration may hinder the downward trend in inflation, causing consumer prices to rise in the short term. Jefferson emphasized that the long-term impact of tariffs depends on the implementation of trade policies, supply chain responses, and overall economic performance. While economic growth may slow, he believes the current monetary policy stance remains moderately restrictive and appropriate to address future economic developments.
The U.S. Bureau of Labor Statistics (BLS) released the Consumer Price Index (CPI) data for April on Tuesday, May 13, 2025. The data showed that April CPI rose 2.3% year-on-year, the lowest level since February 2021, below the market expectation of 2.4%. Month-on-month, the CPI increased by 0.2%, while the core CPI (excluding food and energy) rose 2.8% year-on-year. Despite the overall inflation slowdown, analysts pointed out this might be a temporary phenomenon. The recently announced “Liberation Day” tariff policy by the U.S. government may exert upward pressure on prices in the coming months, especially in categories highly dependent on Chinese imports such as furniture and household goods.
Currently, the Federal Reserve is maintaining interest rates unchanged and continuing to monitor economic performance, awaiting clearer economic signals. The market generally expects two 25 basis point rate cuts in the second half of 2025, with the first possibly in September. However, if future inflation data exceeds expectations, these rate cut expectations may be delayed or canceled, reflecting the Fed’s cautious approach to monetary policy adjustments.
Trade Policy under the Trump Administration
Regarding tariff policies, on May 12, 2025, President Trump announced a 90-day tariff suspension agreement with China. Under this agreement, the U.S. will reduce the average effective tariff on Chinese imports from 145% to 30%, while China will lower tariffs on U.S. goods from 125% to 10%. This temporary agreement aims to provide both sides more room for further negotiations and to ease ongoing trade tensions.
However, Federal Reserve officials and economists have warned that if tariff policies persist, they may obstruct inflation reduction. Especially in the context of incomplete supply chain adjustments, prices of some imported goods may remain high, which would be passed on to end consumers, driving up overall price levels.
3. Hashrate Changes
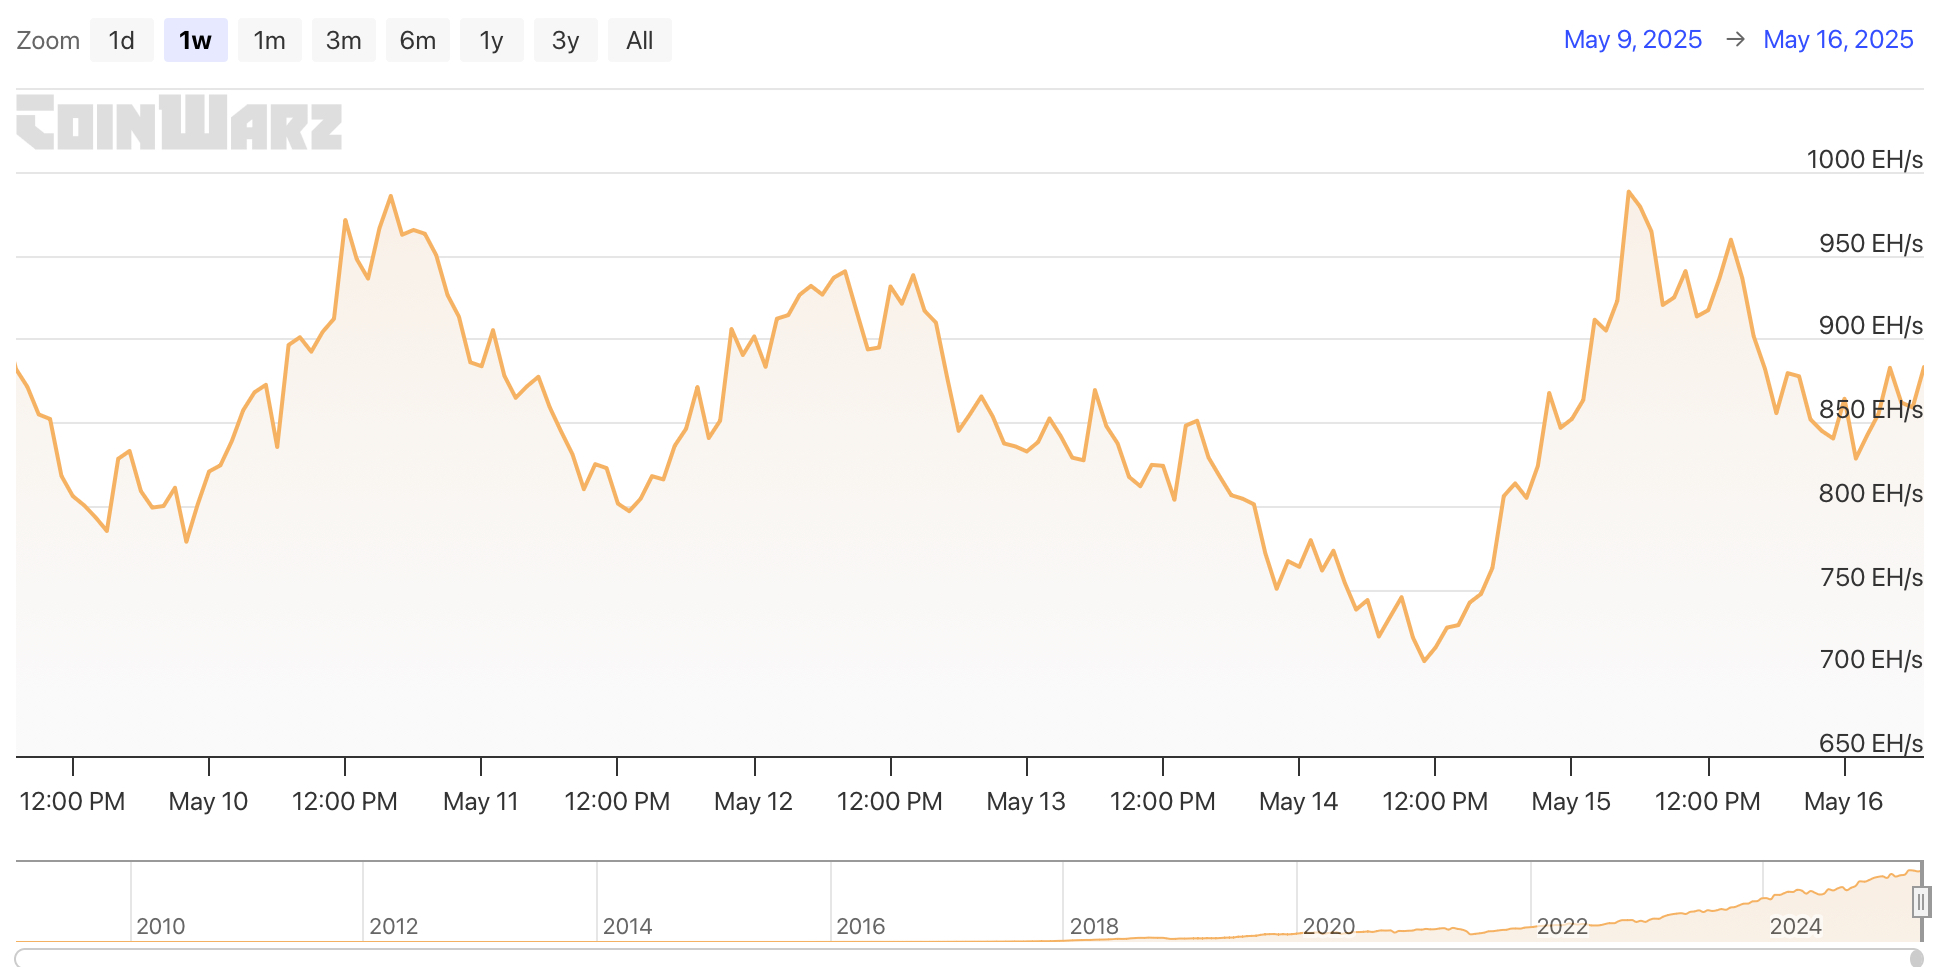
Between May 10 and May 16, 2025, the Bitcoin network’s hashrate showed fluctuations as follows:
On May 10, the total network hashrate steadily rose from 820.36 EH/s, reaching a peak of 985.34 EH/s, marking a temporary high point in this period. It then began to fluctuate downward, closing the day at 883.38 EH/s. On May 11, the downward trend continued, with the hashrate dipping to a low of 796.58 EH/s but gradually recovering in the later period to close at 905.66 EH/s, indicating signs of miner participation recovery in the short term. On May 12, the hashrate continued upward, peaking at 940.22 EH/s, but then retreated briefly to 937.91 EH/s before quickly falling to a low of 844.72 EH/s, closing the day at 832.34 EH/s, showing pressure from hashrate pullback. On May 13, the trend showed a clear oscillating downward structure. The hashrate first dropped to 827.07 EH/s, rebounded to 869.09 EH/s, then fell again to 803.47 EH/s, experienced a slight rebound to 850.74 EH/s, and finally dropped to 750.14 EH/s. On May 14, 2025, the Bitcoin network’s hashrate briefly fell to 706.81 EH/s, creating a temporary low point. Subsequently, the hashrate quickly recovered, rebounding to 813.24 EH/s and 867.34 EH/s, showing that the network’s computational power was gradually rising. Moving into May 15, the hashrate continued its upward momentum, reaching a recent high of 987.94 EH/s during the day, reflecting a rise in miner participation and enhanced network stability. The hashrate then slightly retreated, adjusting to around 828.11 EH/s by the end of the day, showing a technical oscillation correction. On May 16, the hashrate rose again, continuing the phase of recovery, indicating that the Bitcoin network’s computational resources were continuously restoring and the overall hashrate structure was becoming more robust.
Overall, during this period, the Bitcoin hashrate exhibited a pattern of “retracement followed by recovery.” The fluctuations may reflect miner strategic adjustments, changes in electricity costs, or geographical shifts in mining power. Although there was some mid-term pullback, the rapid rebound toward the end of the period demonstrates the network’s overall resilience in hashrate. Going forward, attention should be paid to key on-chain metrics such as hashrate distribution, miner profitability, and block generation time to assess the sustainability of the hashrate trend and the health of the market.
Bitcoin Network Hashrate Data
4. Mining Revenue
According to YCharts data, the daily total revenue of Bitcoin miners (including block rewards and transaction fees) for this week is as follows:May 10: $48.9 million; May 11: $49.49 million; May 12: $50.19 million; May 13: $42.59 million; May 14: $48.03 million; May 15: $48.12 million.
Overall, the miners’ average daily total revenue this week roughly remained in the range of $48 million to $50 million, showing a mild fluctuation trend. Although there was a decline in the mid to late period, the overall revenue remained relatively stable, indicating a healthy interaction between block rewards and transaction fees, with network activity basically stable.
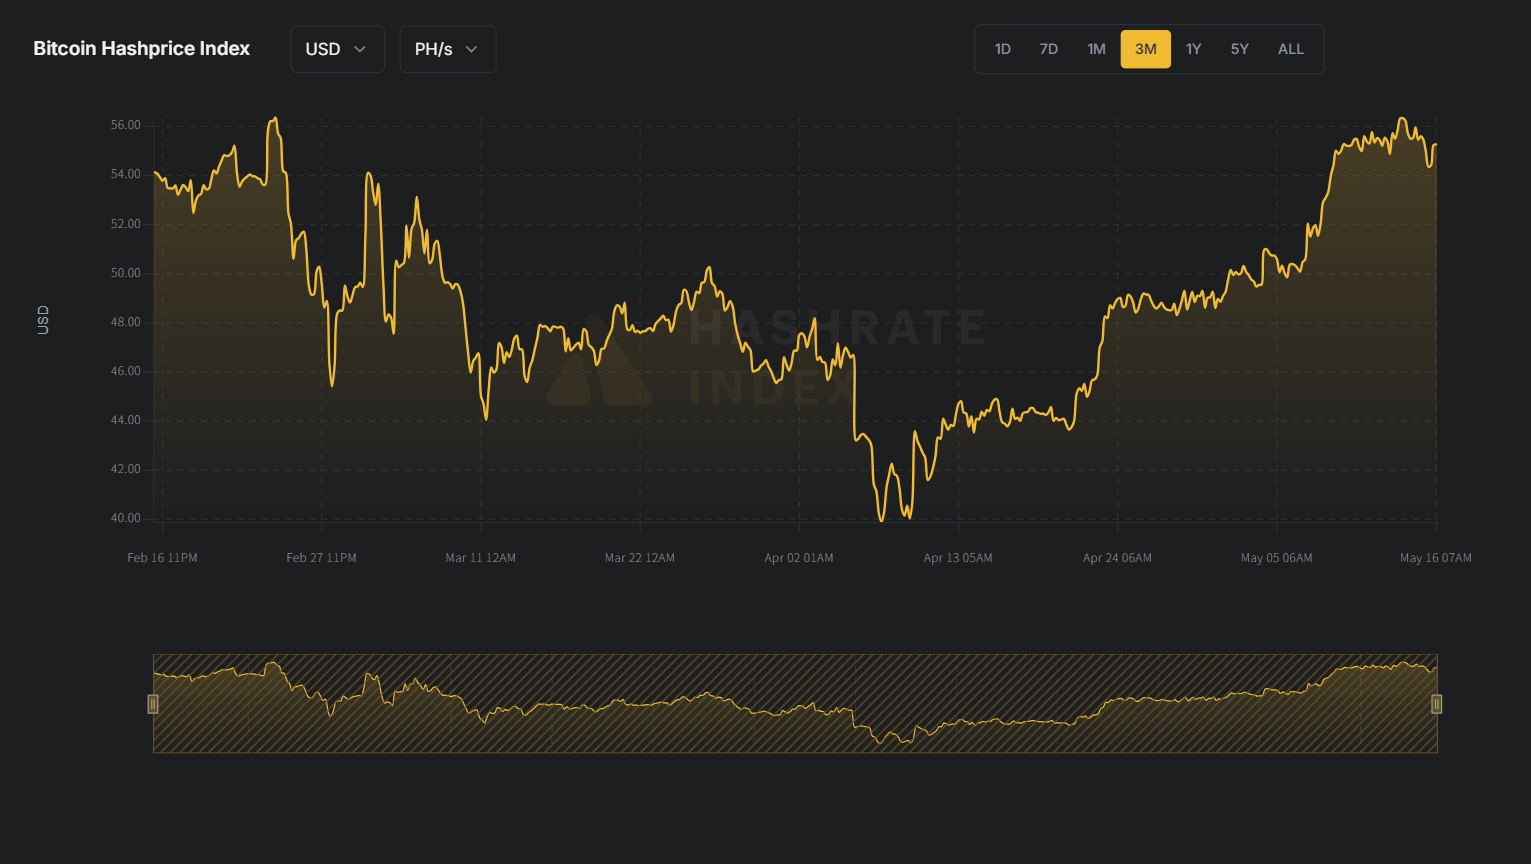
From the perspective of revenue per unit of hashrate, as of now, the Bitcoin hashprice is $55.59 per PH/s per day, with May 13 reaching $56.39 per PH/s per day, a temporary high point for this period. A detailed look shows that from May 10 to 13, the hashprice steadily increased, reflecting increased on-chain transaction activity and rising fee income; from May 13 to 16, the hashprice experienced a slight decline before recovering, which may be related to Bitcoin price fluctuations and consolidation.
From a mid-term trend perspective, the current hashprice is at a relatively high level compared to the past month; from a quarterly dimension, the current level is also within the high range of the past three months, reflecting a relatively favorable current mining revenue environment.
In summary, Bitcoin mining revenue during this period showed stable performance. Despite short-term impacts from market price volatility and network hashrate changes, the overall blockchain operation efficiency and miner profitability remain at a reasonable level. Going forward, attention should be paid to Bitcoin price trends, changes in transaction demand, and adaptive adjustments to the mining economic model after the halving.
Hashprice Data
5. Energy Costs and Mining Efficiency
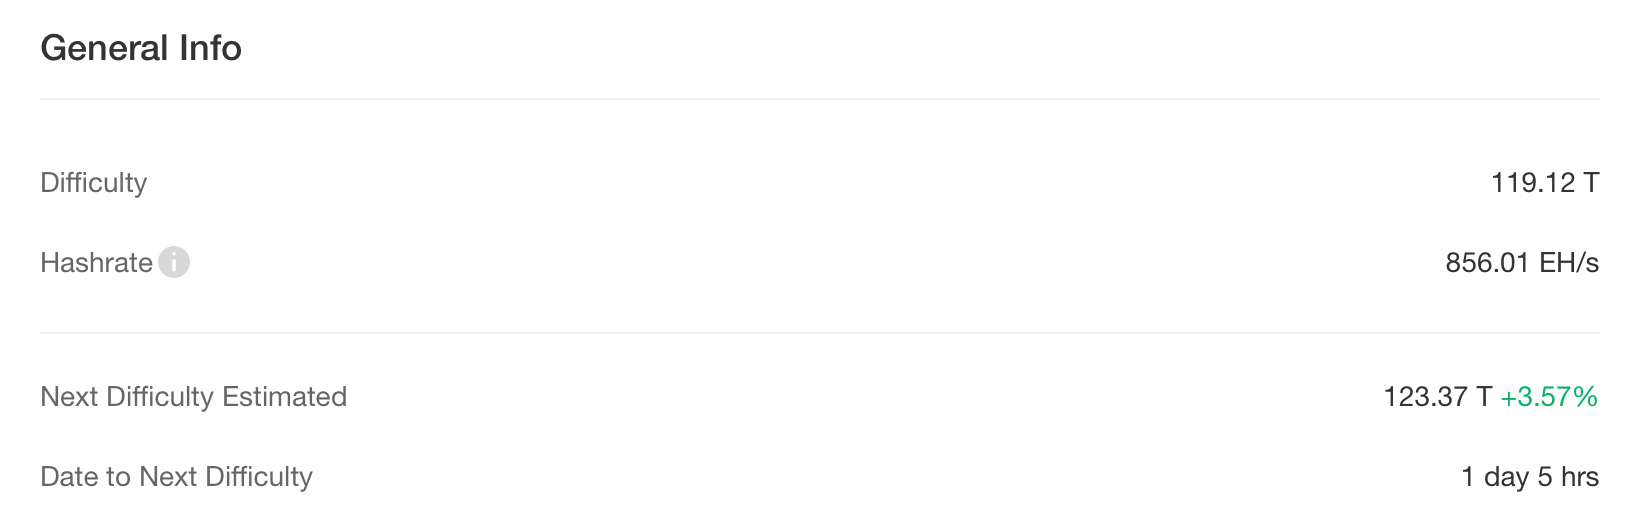
According to data from CloverPool, as of the drafting date on May 16, 2025, the total Bitcoin network hashrate stood at 856.01 EH/s, with the current network mining difficulty at 119.12 T. The next difficulty adjustment is expected to take place on May 17, with an anticipated increase of 3.57%, raising the difficulty to 123.37 T. This trend reflects the continuous growth of Bitcoin network hashrate, indicating that more computing power is joining the network and competition among miners is intensifying.
From the perspective of mining costs, based on the latest model calculations by MacroMicro, as of May 14, 2025, the unit production cost of Bitcoin is approximately $93,416.67, while the spot price at the same time is $103,539.42. The corresponding Mining Cost-to-Price Ratio is 0.90. A ratio below 1 means that current mining activities remain overall profitable.
In summary, although the coin price is fluctuating at a high range, the continuous rise in network hashrate and difficulty shows that miners remain optimistic about the medium- to long-term market outlook. However, under the dual pressure of rising energy costs and difficulty adjustments, the operational efficiency of some high-cost mining farms may face challenges, and the industry is entering a phase of survival of the fittest. Going forward, attention should be focused on electricity price fluctuations, regulatory policy trends, and structural changes in the mining ecosystem under the halving cycle.
Bitcoin Mining Difficulty Data
6. Policy and Regulatory News
Belo Horizonte City Council in Brazil Approves Bitcoin-Related Bill
On May 10, it was reported that the Belo Horizonte City Council in Brazil passed a bitcoin-related bill with 20 votes in favor, 8 against, and 6 abstentions. The bill will provide incentives for businesses accepting bitcoin payments, including promotion in city advertising campaigns and launching educational initiatives to help citizens adapt to digital transformation. The bill has now been submitted to the mayor’s office for final approval.
Ukraine Plans to Launch Strategic Bitcoin Reserve Under New Crypto Law
On May 15, it was reported that Ukraine is developing a legal framework to hold bitcoin within its national reserves. A special parliamentary committee led by financial officials is finalizing the draft legislation. Senior lawmaker Yaroslav Zhelezniak confirmed that Ukraine plans to establish cryptocurrency reserve infrastructure, and he is overseeing the preparation of the relevant legal draft. The proposal aims to regulate how the state acquires, stores, and manages bitcoin reserves, aligning with the anticipated cryptocurrency regulations to be introduced in 2025. The law will support holding digital assets for national fiscal planning, ensuring transparency, compliance, and supervision by the central bank and regulatory agencies.
It is reported that Ukraine is receiving support from Binance to build the national bitcoin reserve, with cooperation including guidance on reserve mechanisms and technical infrastructure. Both parties are actively discussing the implementation of the reserve strategy. Additionally, Ukraine plans to coordinate with the National Bank and the International Monetary Fund to pass a comprehensive digital asset law in early 2025. This law will cover fiscal policy formulation, exchange regulation, anti-money laundering measures, capital gains tax, and clearly define legal responsibilities for market participants and state institutions.
 Related Images
7. Mining News
Analysis: Bitcoin Miners’ Selling Pressure Drops to Lowest Level Since 2024
On May 12, cryptocurrency analysis platform Alphractal revealed in a May 10 article on X that Bitcoin miners’ market activity is declining. They tend to accumulate mining rewards rather than sell them for profit. The lower selling pressure means miners are holding their coins—a positive signal for price.
With price fluctuations expected in the coming weeks, whether up or down, new selling interest may emerge.
Nebraska Passes New Bill Increasing Bitcoin Mining Difficulty Regulations
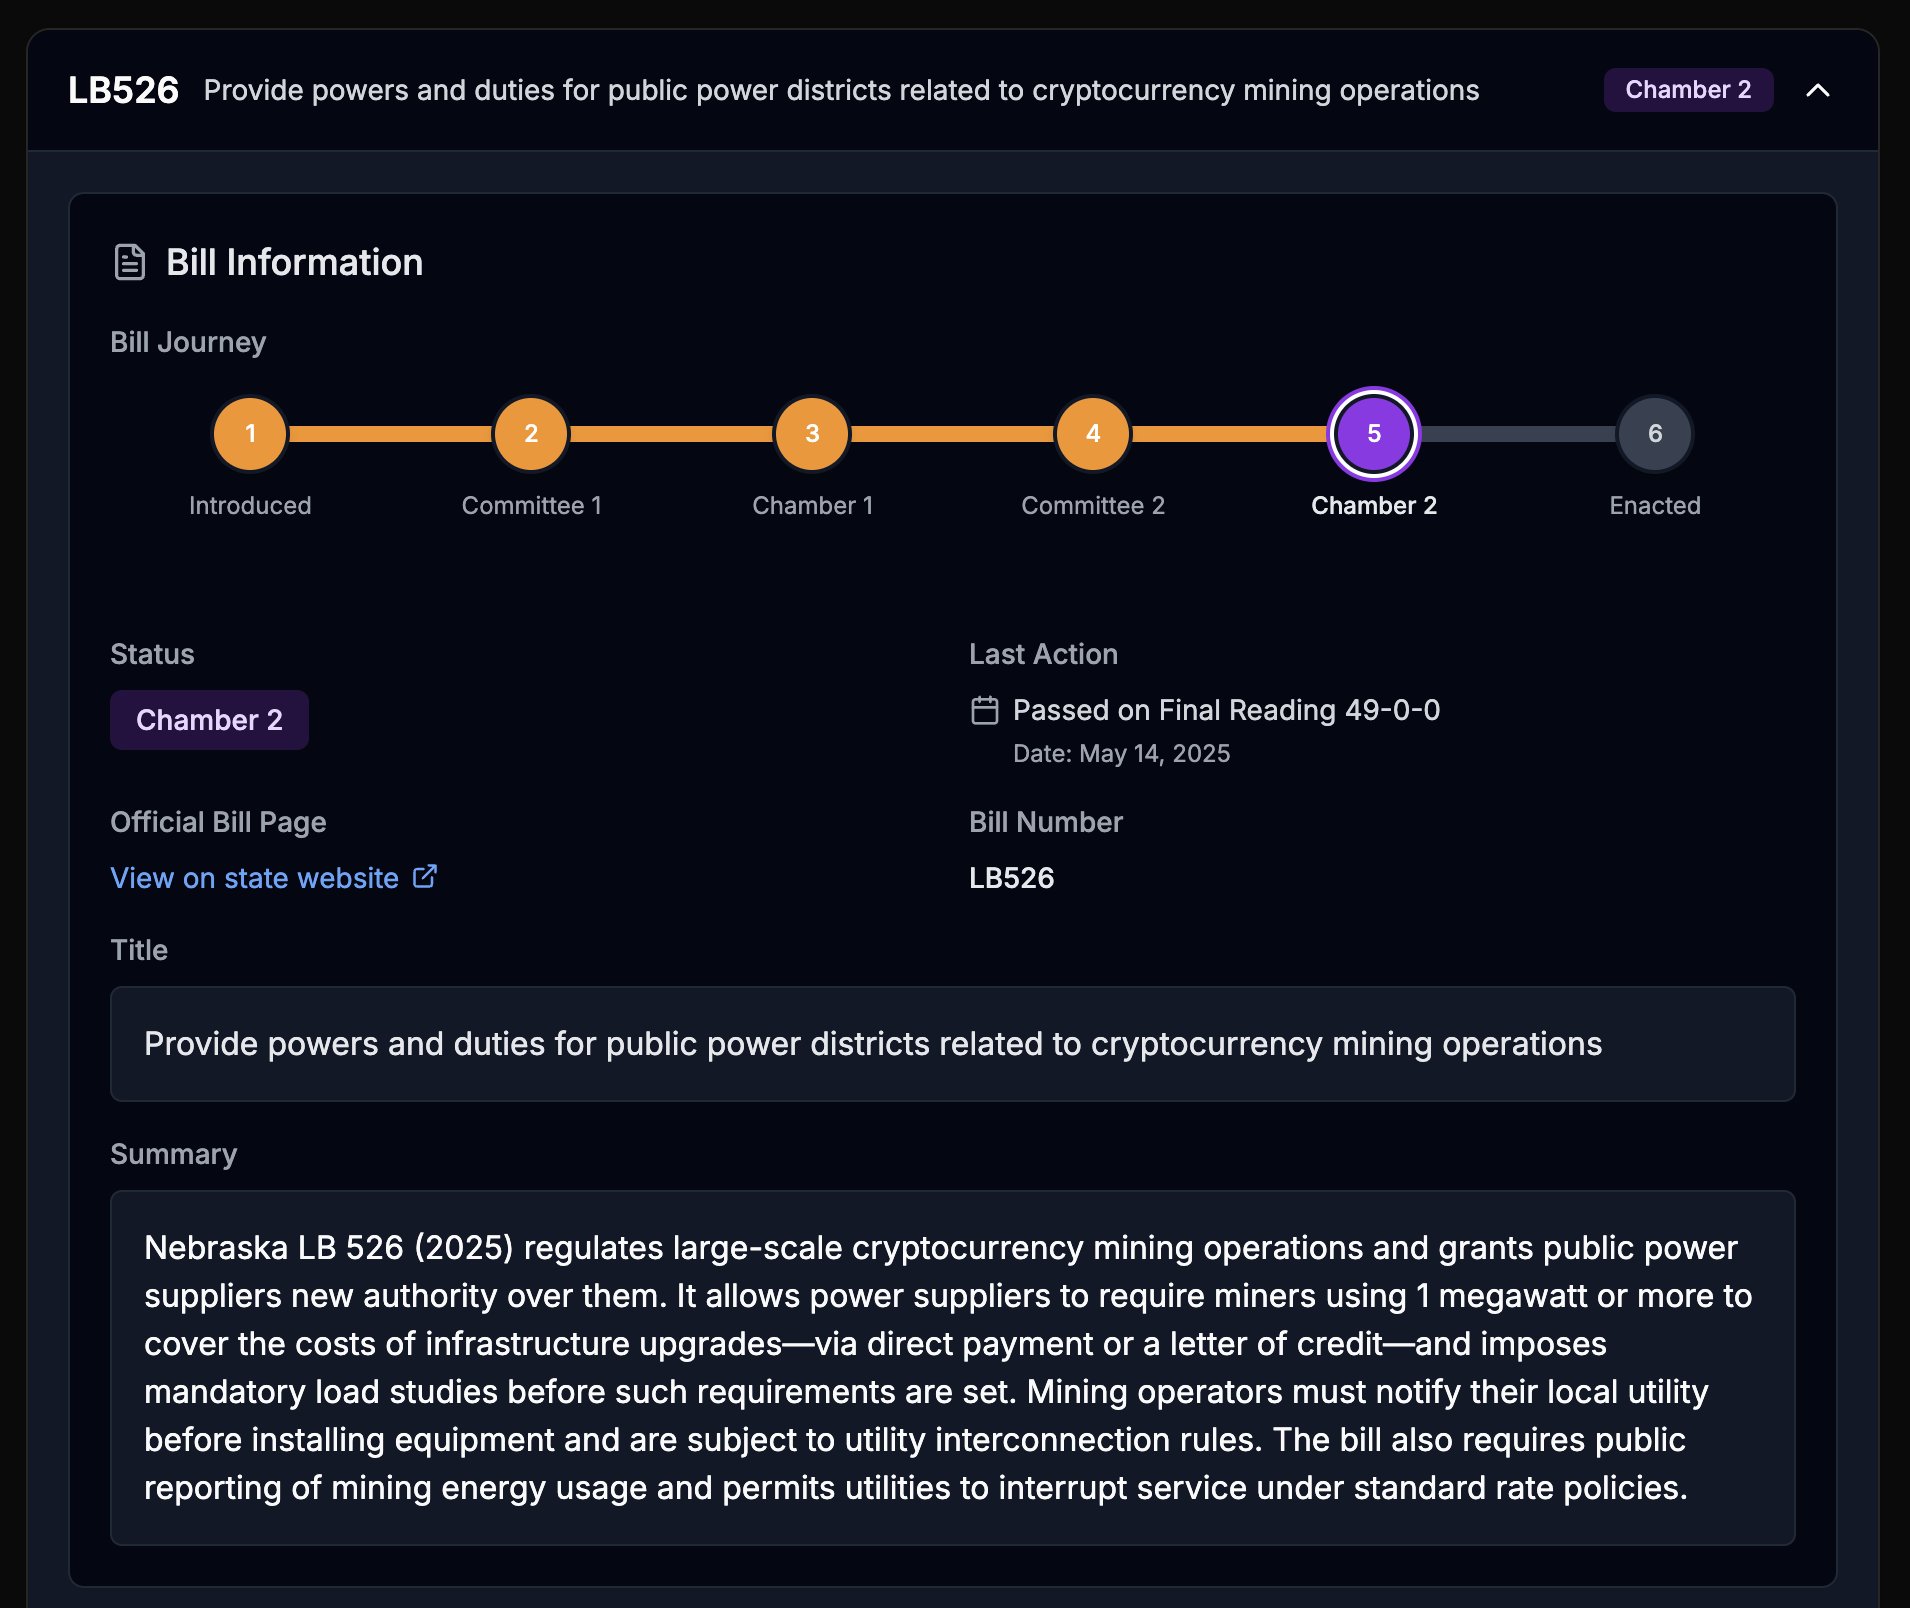
On May 15, it was reported that the Nebraska legislature has just passed a bill regulating Bitcoin miners. The LB 526 bill requires large miners to bear the cost of infrastructure upgrades, mandates reporting of energy usage, and allows authorities to interrupt service. The bill passed unanimously with a 49:0 vote.
Nebraska’s Bitcoin mining bill LB 526 is not a major setback for companies in the state. The bill is just over two pages long and very straightforward. Unlike anti-mining bills, it does not address carbon emissions or other environmental impacts. Instead, it focuses almost entirely on the power grid.
Related Images
8. Bitcoin Related News
Global Corporate and National Bitcoin Holdings (This Week’s Statistics)
1.Japan MetaPlanet : On May 12, Japanese publicly listed company MetaPlanet announced an additional purchase of 1,241 bitcoins at a total price of 18.426 billion yen, increasing its total holdings to 6,796 bitcoins, valued at approximately 90.19 billion yen. The average holding cost is 13.27 million yen per bitcoin. The company also issued a $15 million interest-free bond to continue purchasing Bitcoin.
2.JPMorgan : On May 12, according to CryptoRover, JPMorgan’s total investment in Bitcoin ETFs has surpassed $1.7 billion (about RMB 12.2 billion).
3.El Salvador : On May 12, data from the El Salvador Ministry of Finance website showed that El Salvador increased its Bitcoin holdings by 8 bitcoins over the past week, bringing the country’s total holdings to 6,174.18 bitcoins, with a total value of approximately $641.5 million.
4.Exodus : On May 12, crypto wallet provider Exodus released its Q1 financial report, showing it held 2,011 bitcoins (approximately $166 million) by the end of Q1, an increase of 70 bitcoins from year-end. The total digital asset value was $238 million, including 2,693 ETH and a $62.8 million combination of USDC and government bonds.
5.Twenty One : On May 14, the planned Bitcoin-centric publicly listed company Twenty One announced the purchase of 4,812 bitcoins through Tether, costing $458.7 million at an average price of $95,300 each. The company plans to become a Bitcoin-focused financial services and media platform, with an initial reserve exceeding 42,000 bitcoins.
6.Semler Scientific : Nasdaq-listed Semler Scientific announced its Q1 report, holding 3,808 bitcoins as of May 12, with a fair value of $387.9 million and a total purchase amount of $340 million. The year-to-date Bitcoin investment return rate reached 22.2%.
7.Australia Monochrome : Australia’s Monochrome Bitcoin spot ETF (IBTC) increased its holdings to 446 bitcoins as of May 14, with a market value of approximately $71.29 million.
BlackRock CEO: Bitcoin Expected to Reach $500,000 Within 5-10 Years
On May 10, BlackRock CEO Larry Fink predicted that Bitcoin will surpass $500,000 within the next 5 to 10 years, with a market capitalization potentially reaching $10 trillion. Fink stated, "We will see Bitcoin well beyond $500,000 in the next 5 to 10 years, which will be an asset worth over $10 trillion."
This view reflects the growing confidence of institutional investors in Bitcoin. Currently, there are 11 Bitcoin spot ETFs in the U.S. market with a total assets under management of $118.59 billion, further advancing Bitcoin’s mainstream adoption process.
Cathie Wood: Economic Recession Nearing End, Bitcoin Could Reach $1.5 Million
On May 11, Ark Invest CEO Cathie Wood stated that the economic recession is nearing its end, and the path for Bitcoin to reach $1.5 million remains intact. Artificial intelligence is accelerating productivity and changing the game for investors.

Related Images
Miller Value Partners CIO: Bitcoin Has Surpassed the Six-Figure Mark Again, Still Has Great Growth Potential
On May 11, Miller Value Partners Chief Investment Officer Bill Miller IV told CNBC that cryptocurrency governance is evolving rapidly. He added that Bitcoin has once again crossed the six-figure threshold and, in his view, “still has great room for growth.”
Binance CEO: Institutional Adoption Will Strengthen Bitcoin’s Role as “Digital Gold” and Hedge
On May 12, Binance CEO Richard Teng posted on the X platform stating, “Amid global economic uncertainty, Bitcoin remains the flagship crypto asset and a resilient store of value. With institutional adoption, Bitcoin is expected to play a more important role as a hedge and digital gold in diversified portfolios.”
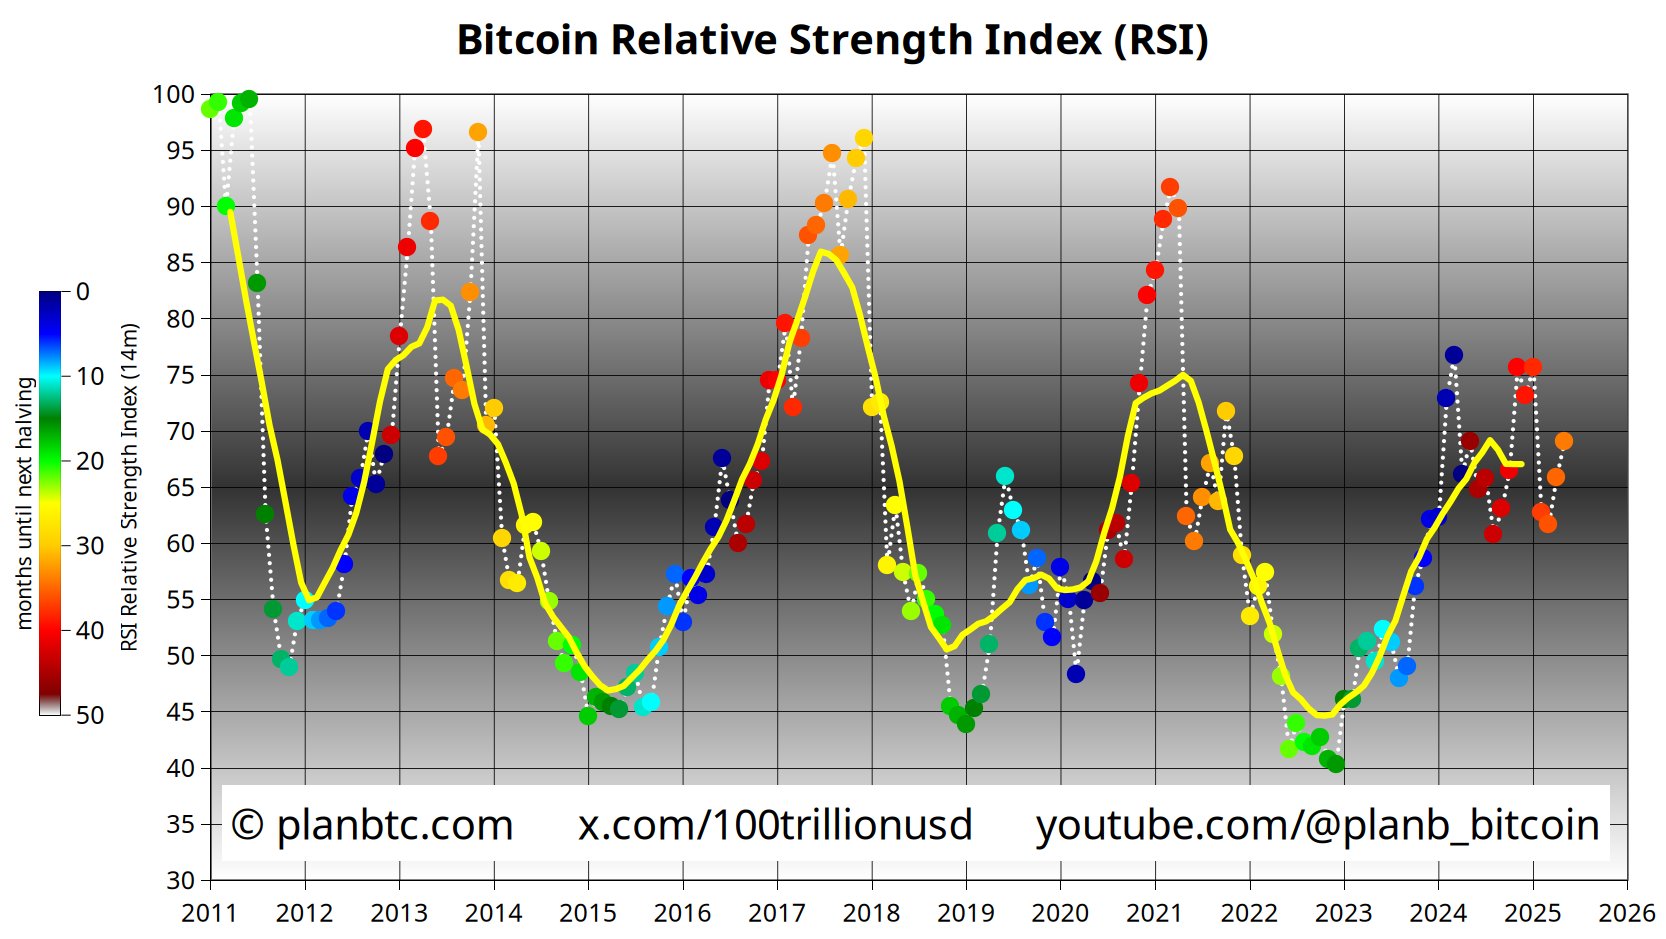
PlanB Predicts Bitcoin Will Enter a Four-Month Strong Bullish Phase
On May 12, Bitcoin analyst PlanB posted on social media that Bitcoin’s current Relative Strength Index (RSI) is 69, and it is expected to enter a bull market phase lasting at least four months with an RSI above 80. Referring to the market trends in 2013, 2017, and 2021, months with RSI above 80 saw an average monthly Bitcoin price increase of over 40%. If this pattern repeats, Bitcoin’s price could rise from the current approximately $104,000 to $400,000.
Related Images
Tim Draper Predicts Bitcoin Price to Reach $250,000 by Year-End
On May 13, billionaire venture capitalist Tim Draper predicted that Bitcoin’s price will rise to $250,000 by the end of 2025 and will replace the U.S. dollar as the dominant currency within ten years. Draper advises that every corporate finance department should hold Bitcoin reserves to prepare for fiat bank runs and the global shift to a Bitcoin standard.
Strategy: Confident Bitcoin Will Surpass One Million Dollars Within 10 Years
On May 14, Strategy analyst Jeff Walton stated in the Financial Times documentaryMichael Saylor’s $4 Billion Bitcoin Betthat, empowered by Bitcoin’s financial strength, MicroStrategy will eventually become the world’s top publicly traded company by market capitalization.
Currently, MicroStrategy holds approximately 568,840 bitcoins (valued at $59 billion). Analysts believe this advantage will enable it to surpass all other listed companies in the future. Michael Saylor himself also said in the documentary that Bitcoin’s price will definitely break one million dollars within 10 years and achieve a tenfold increase after 20 years.
Coinbase Executive: Rising Global Trade Protectionism Is Reshaping Capital Flows, Bitcoin May Seize $1.2 Trillion Market Growth Opportunity
On May 15, Coinbase’s Head of Institutional Research David Duong released a monthly outlook report revealing that rising global trade protectionism is reshaping capital flows and challenging the U.S. dollar’s status as the world’s reserve currency. The report notes that the U.S. faces twin fiscal and trade deficits and unsustainable debt issues, which may continuously erode investor confidence in the dollar’s safe-haven status.
The report suggests that amid the evolving monetary landscape, store-of-value assets like gold and Bitcoin have become credible alternatives. Especially, Bitcoin as a sovereign-neutral asset, free from sanctions or capital controls, is poised to become a super-sovereign unit of account in international trade. Should countries begin diversifying international reserves, Bitcoin could gain $1.2 trillion in market capitalization.
Russian Central Bank Names Bitcoin the Best-Performing Asset in the Country’s Financial Market for April 2025
On May 16, the Russian Central Bank rated Bitcoin as the best-performing asset in Russia’s financial market for April 2025, with a price increase of 11.2% that month. The bank also highlighted that Bitcoin’s year-to-date performance ranks first with a 17.6% return, outperforming stocks, bonds, and gold. Although Bitcoin experienced an 18.6% short-term volatility decline between January and April 2025, since 2022, it has been recognized as the best-performing global investment product, delivering a cumulative return of 121.3%.
Over the past year, Bitcoin was recognized by the Russian Central Bank as the most profitable investment product, with a 38% return. Since 2022, Bitcoin’s cumulative return of 121.3% has significantly outpaced traditional assets such as gold, stocks, and the S&P 500 index. This recognition comes amid unprecedented institutional interest in Bitcoin.


